Assalamu’alaikum Wr. Wb.
hasil akhir
alamat server slave di ralat di http://appscenter.aio.co.id/weatherlogger/
alamat master logger di http://weatherlogger.ap.ngrok.io/
Oke saya lanjutkan. remind lagi ini adalah seri berantai dari posting berikut ya
- https://tarecha.wordpress.com/2015/10/26/project-raspberry-pi/
- https://tarecha.wordpress.com/2017/06/05/project-weather-logger-part-1/
- https://tarecha.wordpress.com/2017/06/26/project-weather-logger-part-2-tambahan-sensor-tekanan-udara/
- https://tarecha.wordpress.com/2017/07/01/project-weather-logger-part-3-komunikasi-udp/
- https://tarecha.wordpress.com/2017/07/15/project-weather-logger-part-4-simpan-di-server-mysql/
- https://tarecha.wordpress.com/2017/07/24/project-weather-logger-part-5-view-data-dan-export/
- https://tarecha.wordpress.com/2017/07/25/project-weather-logger-part-6-plot-graphic/
- https://tarecha.wordpress.com/2017/07/29/project-weather-logger-part-7-ngrok-http-tunneling/
- https://tarecha.wordpress.com/2017/08/27/project-weather-logger-part-8-ganti-sensor-bme280/
- https://tarecha.wordpress.com/2017/09/03/project-weather-logger-part-9-sync-data/
- https://tarecha.wordpress.com/2018/01/13/project-weather-logger-part-10-notifikasi-email-dan-autostart-dan-backup/
oke semakin kesini IoT akan semakin rumit dan kompleks. ya sebenernya bikin ini gk bisa langsung jadi uang berapa. tapi setiap percobaan akan menambah skill kita dalam koding dan analisa alur sistem.
untuk bikin BOT Twitter kita harus mengaktifkan aplikasinya dahulu . saya ambil contoh tutorial berikut untuk mengaktifkan twitter. http://nodotcom.org/python-twitter-tutorial.html
1. Mematikan notif sms
hal ini penting agar bot kita banyak tweet gk perlu sms. cukup menganggu nanti. coba akses https://twitter.com/settings/devices dan matikan notifikasinya dengan login dahulu
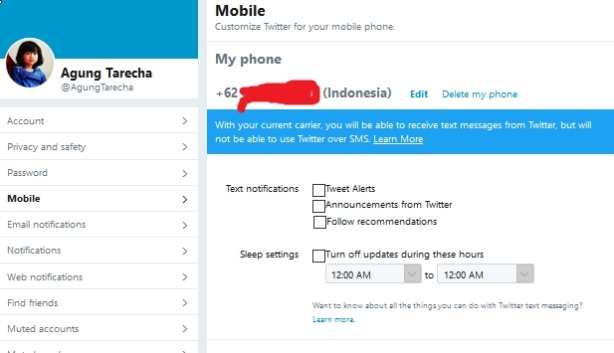
matikan Notifikasi SMS
2. buat aplikasi tweet
Twitter Apps -> Create New App -> Leave Callback URL empty -> Create your Twitter application.
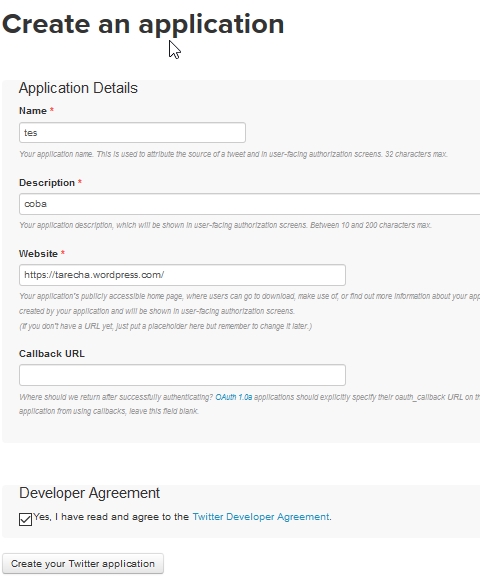
Create Aplication
3. ganti permission tweet write.
masuk ke aplikasi yang sudah dibuat dan masuk ke tab permission
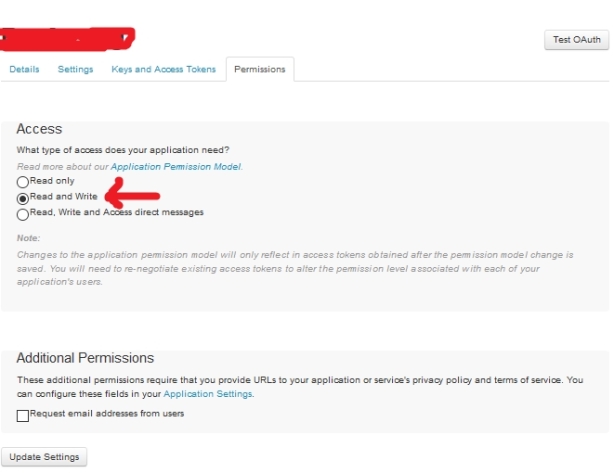
Ganti Write
4. ambil token dan generate access
sama seperti yang link tutorial diatas. untuk membuat access key klik generate customer key and secret dan generate access token.
Access Token, Access Token Secret, Consumer Key (API Key), Consumer Secret (API Secret). yang dibutuhkan adalah value dari id berikut. dan ingat ini rahasia
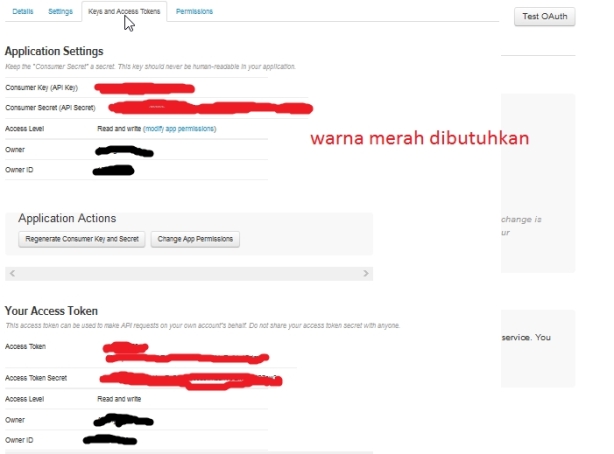
Get Token
5. buat file tweet universal sebagai modul
untuk bisa pakai paket tweepy maka harus install dahulu. caranya di windows lumayan gampang. caranya pakai pip install
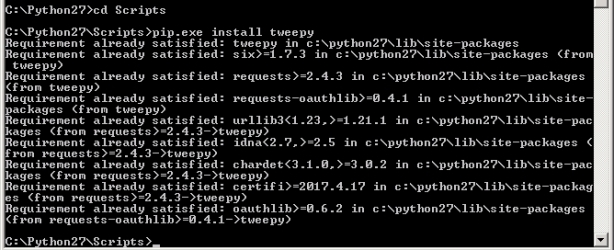
Install modul Tweepy dengan PIP Install
buat file python sebagai berikut. meski saya tahu ada double nya karena ada penulisan yang double buat akses key nya. tapi yang penting jalan dulu. dari tutorial asli diatas saya tambahkan kirim tweet gambar sehingga bisa tweet gambar lalu menghapus gambar yang sudah di tweet.
simpan dengan nama tweetsend.py
import tweepy
import os

def get_api(cfg):
  auth = tweepy.OAuthHandler(cfg['consumer_key'], cfg['consumer_secret'])
  auth.set_access_token(cfg['access_token'], cfg['access_token_secret'])
  return tweepy.API(auth)

def kirimtweet(isi):
  # Fill in the values noted in previous step here
  cfg = {
    "consumer_key"        : "customer key dari step diatas",
    "consumer_secret"     : "customer screet dari step diatas",
    "access_token"        : "access token dari step diatas",
    "access_token_secret" : "access token key dari step diatas"
    }

  api = get_api(cfg)
  tweet = isi
  status = api.update_status(status=tweet)
  # Yes, tweet is called 'status' rather confusing


def kirimtweetgambar(isi,gambarpath):
  # Fill in the values noted in previous step here
  cfg = {
    "consumer_key"        : "customer key dari step diatas",
    "consumer_secret"     : "customer screet dari step diatas",
    "access_token"        : "access token dari step diatas",
    "access_token_secret" : "access token key dari step diatas"
    }

  api = get_api(cfg)
  tweet = isi
  status = api.update_with_media(gambarpath,status=tweet)
  os.remove(gambarpath)
6. membuat tweet dengan gambar
ini bagian yang lumayan sulit karena belum nemu caranya. tapi akhirnya nemu juga.
pertama ==>install selenium pakai pip install. karena punya saya sudah ada maka tulisannya sudah ada . dan schedule juga sekalian

PIP Instal selenium dan schedule
kedua ==> download firefox driver gecko https://github.com/mozilla/geckodriver/releases
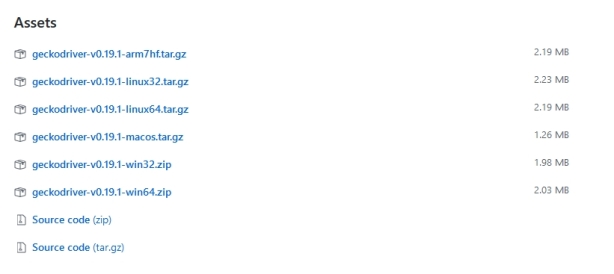
Download sesuai OS
kemudian exstrak geckodriver.exe di folder yang sama dengan file python untuk tweet nya. misal di document C:\Users\<bama user>\Desktop\program python agung
buka advanced tab. environment variabel. di pathnya masukkan tambahi ” C:\Users\<bama user>\Desktop\program python agung; ”
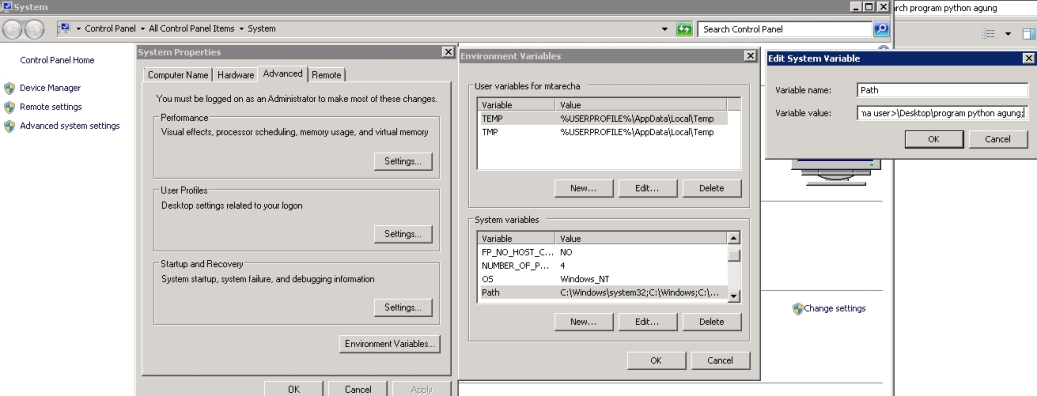
Penambahan path environment variable
bikin coding berikut di folder yang sama dengan tweetsend.py karena nanti import file tersebut
from selenium import webdriver
import tweetsend
import datetime
import schedule
import time
import sys
global waktu
i=0
global jumtweet
jumtweet = 0
jadwal = "23:59"
def job():
try:
waktu = datetime.datetime.now().strftime('%Y-%m-%d')
path = 'C:\\Users\\mtarecha\\Desktop\\program python agung\\firefoximage.png'
source = 'http://appscenter.aio.co.id/weatherlogger/grafiklast24hourdate.php?node=N1&tgl='+ waktu
pesan = 'Selamat malam, berikut informasi cuaca di Rumah selama 24 jam terakhir detail di '+source
driver = webdriver.Firefox()
driver.set_window_size(800, 800)
driver.implicitly_wait(5)
driver.get(source)
driver.save_screenshot(path)
driver.quit()
tweetsend.kirimtweetgambar(pesan,path)
global jumtweet
jumtweet += 1
except Exception as e:
print 'Error Message '+ str(e)
print('Error on line {}'.format(sys.exc_info()[-1].tb_lineno), type(e).__name__, e)
print "General Error Unexpected error:", sys.exc_info()[0]
schedule.every().day.at(jadwal).do(job)
while True:
schedule.run_pending()
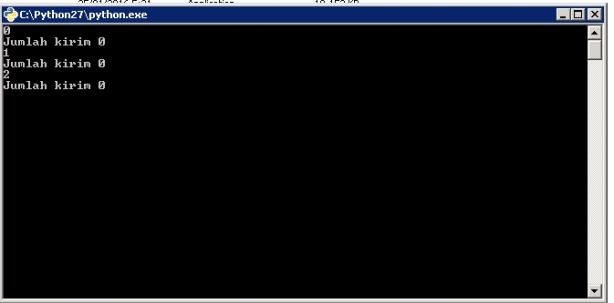
print i
i+=1
print 'Jumlah kirim '+str(jumtweet)
time.sleep(2)
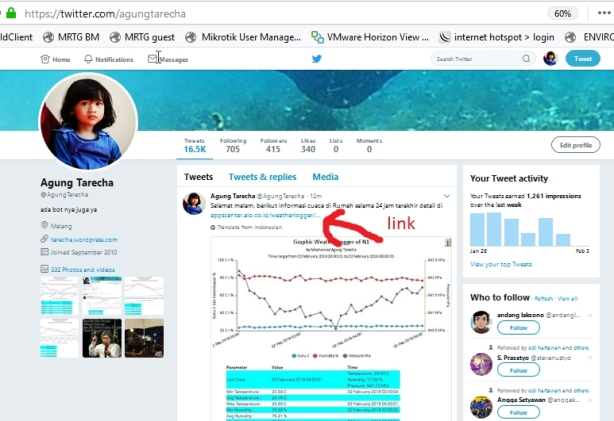
hasilnya akan tweet jam 23:59 dengan gambar berikut. nanti di counting sudah tweet berapa kali
Tweet BOT
7. membuat file grafiklast24hour dengan input tanggal sehingga ketika di tweet gambar ada link yang bisa diklik dan menampilkan grafik informatif javascript nya . sebenarnya sama dengan grafiklast24hour.php cman dikasi parameter tanggal saat ini
berikut grafiklast24hourdata.php
<?php include "header.php"; include "config.php"; if(isset($_GET['node'])&&isset($_GET['tgl'])) { $idnode = $_GET['node']; $tgl = $_GET['tgl']; } $query = "select unix_timestamp(waktu)*1000 as x,temp,hum,press,waktu from masterdata where idnode='$idnode' and date(waktu)= '$tgl' order by waktu asc"; $querysummary = "select min(temp) as mintemp, round(avg(temp),2) as avgtemp, max(temp) as maxtemp, min(hum) as minhum, round(avg(hum),2) as avghum, max(hum) as maxhum, min(press) as minpress, round(avg(press),2) as avgpress, max(press) as maxpress from masterdata where idnode='$idnode' and date(waktu)= '$tgl' order by waktu asc"; $data = mysqli_query($conn, $query); $dataPointstemp = array(); $dataPointshum = array(); $dataPointspress = array(); while ($row = mysqli_fetch_array($data, MYSQL_ASSOC)) { array_push($dataPointstemp,array('x'=>$row['x'],'y'=>$row['temp']));
	array_push($dataPointshum, array('x'=>$row['x'],'y'=>$row['hum']));
	array_push($dataPointspress, array('x'=>$row['x'],'y'=>$row['press']));
}

$lastTemp = end($dataPointstemp)['y'];
$lastHum = end($dataPointshum)['y'];
$lastPress = end($dataPointspress)['y'];
//ambil tanggal start date dan end date
$firstupdateU = reset($dataPointstemp)['x']/1000;
$lastupdateU =end($dataPointstemp)['x']/1000;
$firstupdate = date("d F Y H:i:s",$firstupdateU);
$lastupdate = date("d F Y H:i:s",$lastupdateU);

//bikin strip garis pembagi per pukul 00:00
$firstupdatetengahmalam = date("d F Y  H:i:s",$firstupdateU);
$begin = (new DateTime( $firstupdatetengahmalam ))->setTime(0,0);
$end = new DateTime( $lastupdate );
$begin = $begin->modify( '+1 day' );
$interval = new DateInterval('P1D');
$daterange = new DatePeriod($begin, $interval ,$end);

$datasummary = mysqli_query($conn, $querysummary);
$summary = mysqli_fetch_assoc($datasummary);


?>

<body style="padding-top: 3px;">


<div id="chartContainer"></div>


<div style="position: absolute;top:420px;left:50px;">
<?php include "summary.php"; ?>
</div>

</body>
bagian bawah dari file yang sama
<script type="text/javascript">
$(function () {
    var chart = new CanvasJS.Chart("chartContainer", {
        theme: "theme",
        zoomEnabled: true,
		exportEnabled: true,
        animationEnabled: false,
		axisY:
		{
			title: "Suhu C dan Kelembapan %",
            titleFontFamily: "arial",
            titleFontSize: 12,
            includeZero: false,
			suffix: " C / %"
        },
		axisY2:
		{
            title: "Pressure hPa",
            titleFontFamily: "arial",
            titleFontSize: 12,
            includeZero: false,
			lineColor: "#86b402",
            suffix: " hPa"
        },
        title:
		{
            text: "Graphic Weather Logger of <?php echo $idnode;?>"
        },
	subtitles:[
		{
			text: "by Mochamad Agung Tarecha"


		},
		{

			text: "<?php echo "Time range from ".$firstupdate ." to ". $lastupdate;?>"

		}
		],

		axisX:
		{   stripLines: [
		<?php
			foreach($daterange as $date)
			{


				echo "{";
				echo "value: ".(string)$date->format("U").'000,';
				echo "showOnTop: false";
				echo "},";
			}
		?>

            ],
			valueFormatString: "DD MMM YYYY HH:mm"
		},
		toolTip:
		{
            shared: true
        },
        data: [
        {

            type: "line",
			xValueType: "dateTime",
			xValueFormatString:"DD MMM YYYY HH:mm:ss",
			showInLegend: true,
			name: "Suhu C",
            dataPoints: <?php echo json_encode($dataPointstemp, JSON_NUMERIC_CHECK); ?>
        },
		{

            type: "line",
			xValueType: "dateTime",
			xValueFormatString:"DD MMM YYYY HH:mm:ss",
			showInLegend: true,
			name: "Humidity %",
            dataPoints: <?php echo json_encode($dataPointshum, JSON_NUMERIC_CHECK); ?>
        },

	{
            type: "line",
            axisYType: "secondary",
			xValueType: "dateTime",
			xValueFormatString:"DD MMM YYYY HH:mm:ss",
            name: "Pressure hPa",
			showInLegend: true,
            dataPoints: <?php echo json_encode($dataPointspress, JSON_NUMERIC_CHECK); ?>
        }

        ],
		legend: {
                cursor: "pointer",
				horizontalAlign: "center",
				verticalAlign: "bottom",
                itemclick: function (e) {
                    if (typeof (e.dataSeries.visible) === "undefined" || e.dataSeries.visible) {
                        e.dataSeries.visible = false;
                    }
                    else {
                        e.dataSeries.visible = true;
                    }
                    chart.render();
                }
            }
    });
    chart.render();
});
</script>
</html>
berikut hasil akhirnya
hasil akhir


